Introducing SAPDA – a powerful new admixture inference software – In progress
OVERVIEW
After extensive research and development we are pleased to introduce SAPDA; a program for inference of Shared Ancestral Population Defining Alleles.
We have developed SAPDA to address some of the limitations and weaknesses in the publicly available programs such as ADMIXTURE, STRUCTURE, and PCA (including PCA based nMonte when used for admixture inference). SAPDA also empowers the customer with important additional information related to derived alleles or mutations they share with various populations. This information is facilitated via informative graphs and charts which enable users to visualize important information regarding their ancestry.
SAPDA contains hundreds of lines of code and unlike other programs which only output 1 admixture percentage table or chart, SAPDA outputs 11 graphs and charts to detail various aspects of the user’s ethnogenesis. Results shown herein depict SAPDA output plots for 2 case examples; a British individual, and an E African individual from Sudan. The following are outputted by SAPDA:
- Three admixture percentage pie-charts for mutations shared by the user with various calculator source populations, based on the age of those mutations, as shown in fig 1 & fig 2;
- The user’s Single Population Sharing or GSI (see definitions below) for various source populations, as shown in fig 3 & fig 4;
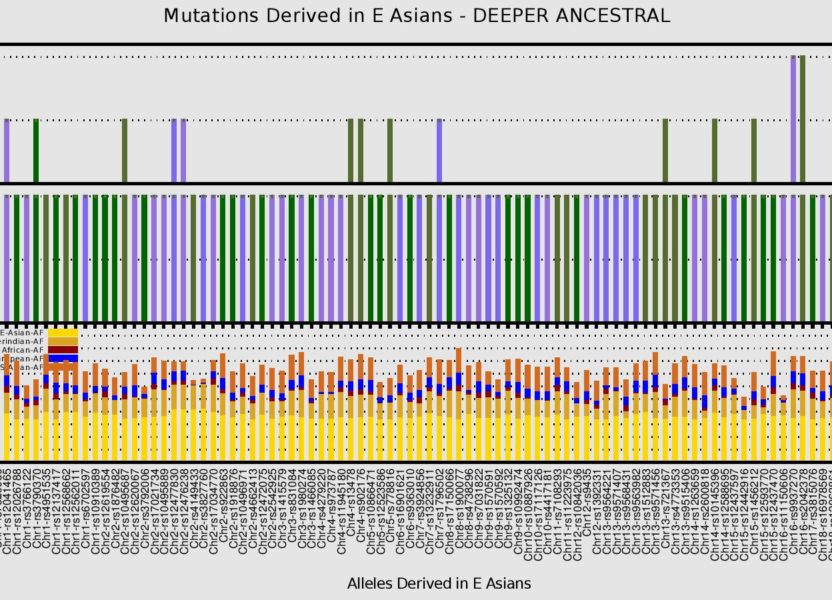
- Bar plots showing precisely which population defining alleles (derived mutations) the user shares with the various source populations, for the 3 classes of mutations shown in figs 5-13;
- The allele frequencies for those population defining alleles the user shares with the various source populations as shown in figs 5-13;
- The genotypes of those population defining alleles shared between the user and various source populations as shown in figs 5-13;
SAPDA offers several advantages over PCA based programs and the program ADMIXTURE. In contrast to ADMIXTURE, the direction of geneflow can be inferred with SAPDA.
PCAs and ADMIXTURE are useful for population clustering purposes, but not informative to the amount of admixture from geographically or genetically more distant populations. For example, if the objective is to determine the amount of E Asian admixture in a W Asian subject, then that E Asian admixture is masked by admixture from more geographically and genetically more proximate W Asian populations. Thus if a W Asian individual is modeled as 70% W Asian + 20% S Asian + 9% European + 1% E Asian, then the actual amount of E Asian admixture in the W Asian subject is masked by the W Asian + S Asian + European percentages. This is further discussed below.

Fig 1 – British user admixture percentages based on population defining mutation sharing with various populations for different time scale mutations

Fig 2 – Sudanese user showing no shared mutations with Europeans and E Asians, except a few older mutations

Fig 3 – British user population defining mutation sharing with various populations for different time scale mutations

Fig 4 – Sudanese user has a GSI of 100% with Africans thus indicating no shared population defining on a more recent time frame
DEFINITIONS
- Dataset: 1000 Genomes Phase 3 dataset mapped to Hg37 human reference, containing genotypes for 80 million positions and allele frequency information for populations defined as AFR, EUR, EAS, SAS, & AMR;
- Reference Populations
- AFR: Yoruba & Esan (Nigeria), Luhya (Kenya), Gambians (Gambia), Mende (Sierra Leone);
- EAS: Han (China), Japanese, Dai (China), & Kinh (Vietnam);
- EUR: N & W Europeans, Toscani (Italy), Finnish, British, & Iberians (Spain);
- SAS: Gujarati Indians (Houston, TX), Punjabis (Lahore), Bengalis (Bengaladesh), Sri Lankan Tamils, & Indian Telugu;
- AMR: Mexicans (Los Angeles), Puerto Ricans, Columbians, & Peruvians.
- GSI: Genotype Similarity Index. This should not be confused with admixture percentage. It is proportional to the number of alleles in agreement between the user and the population defining alleles for the various source populations and is a direct measure of shared derived ancestry between the user and population sources and thus a more accurate quantifier of shared ancestry between the user and the respective population.
- SAPDA also outputs statistics on shared derived alleles between the user and various populations for 3 ancestral time frames:
- Ancestral: This refers to mutations derived in various populations which are younger than Deep Ancestral and Deepest Ancestral categories. Shared alleles in this category may imply a more recent admixture event between the user’s ancestors and populations ancestral to the sources;
- Deep Ancestral: Mutations derived in sources likely older than alleles in the “Ancestral” category;
- Deepest Ancestral:Mutations derived in sources likely older than alleles in the “Deep Ancestral” category.
METHODOLOGY
The dataset used to infer allele frequencies and population defining alleles is the 1000 Genomes Phase 3 dataset mapped to Hg37 human reference. This dataset contain genotypes for 80 million positions and allele frequency information for populations defined as AFR, EUR, EAS, SAS, & AMR. A detailed description of the sub-populations contained withing these populations is given above in the “Definitions’ section.

Fig 5 – British user shares 18 out of 189 defining alleles with E Asians on a “Deeper Ancestral” level, and is hetrozygous for the “C” and “T” alleles at 2 E Asian derived allele positions on chr16

Fig 6 – British user shares 7 out of 70 African derived alleles with Africans on a “Deeper Ancestral” time scale. the lower bar plot indicates that these alleles are also present at lower frequencies and thus may be associated with a late Paleolithic or early Neolithic migration out of Africa

Fig 7 – British user shares 21 out of 24 defining alleles with Europeans on a “Deeper Ancestral” level

Fig 8 – Sudanese user shares 6 out of 100 E Asian defining alleles with E Asians on a “Deeper Ancestral” level. Although present in E Asians at a higher frequency than in Africans & Europeans, they likely reflect chance mutations in Africans

Fig 9 – Sudanese user shares 28 out of 35 African defining alleles with Africans on a “Deeper Ancestral” level

Fig 10 – Sudanese user shares a “T” European derived allele at chr2-rs1567803 with Europeans on a “Deeper Ancestral” level. This allele has a relatively high frequency of about 23% in S Asians, and is likely a pre-Bronze Age mutation spread to S Asia via a Eurasian Steppe population, and to Africans via a back migration to Africa event
BENEFITS OF SAPDA OVER OTHER ADMIXTURE SOFTWARE:
- The program ADMIXTURE is not informative to the direction of geneflow. Thus if a European user tested with ADMIXTURE shows 2% African, we don’t know whether this is due to an African ancestor or whether this sharing is due to historical “back to Africa” migration events transmitting Eurasian DNA from populations in the Near East to African populations. With SAPDA, on the other hand, one can determine the direction of geneflow via the allele frequency/ allele sharing bar plots as shown in figs 5 thru 22. For example, fig 4 shows the Sudanese individual shares with Europeans 4.2% of alleles derived in Europeans, on a deeper time scale level. A glance at figure 10 confirms that the Sudanese individual shares 1 copy of the “T” European derived allele at chr2-rs1567803 with Europeans. The bottom plot in fig 4 shows this allele has a relatively high frequency of about 23% in S Asians, and is likely a pre-Bronze Age mutation spread to S Asia via a Eurasian Steppe population, and to Africans via a back migration to Africa event;
- Stricter guidelines over allele frequency thresholds correlated with population defining mutations. The SAPDA algorithm does not permit the use of genomic positions for which the allele frequency differential between 2 ancestral source populations is small. This is different than say ADMIXTURE where positions are permitted where the allele frequency differential between 2 source populations is small. The reason we adopted stricter guidelines is because in a Eurasian SNP panel there are many West Eurasian polymorphic positions which are ancestral in both East Eurasians and Africans.
- There are many positions which are polymorphic in Europeans, but predominantly homozygous ancestral in Africans and E Asians. Thus both Africans and E Asians have high frequencies of the ancestral allele at those positions. For example, if those positions were to be assigned as “African” in programs such as ADMIXTURE, then E Asians would erroneously score an increased “African” percentage due to those positions, and visa versa. SAPDA identifies and filters out those positions.
- PCAs and ADMIXTURE are useful for population clustering purposes, but not informative to the total amount of admixture from geographically or genetically more distant populations. For example, if the objective is to determine the amount of E Asian admixture in a W Asian subject, then that E Asian admixture is masked by admixture from geographically and genetically more proximate W Asian, S Asian, and European populations. Thus if a W Asian individual is modeled as 70% W Asian + 20% S Asian + 9% European + 1% E Asian, then the actual amount of E Asian admixture in the W Asian subject is masked by the W Asian + S Asian + European percentages. This is partly because E Asian derived alleles are included in the genetic substructure of W Asian, S Asian, and European populations, and partly due to the nature of fractions as detailed in the following section.

Fig 12 – British user does not share any defining alleles with E Asians on a relatively nearer “Ancestral” time scale

Fig 14 – Sudanese user shares 4 out of 4 African defining G mutations with Africans on an “Ancestral” level
DIFFERENCES BETWEEN ADMIXTURE PERCENTAGES & GSI
It’s important to understand that admixture percentages don’t accurately quantify the amount of geneflow or admixture between the test subject and the various calculator source populations. For example, 2 individuals from different parts of the world are tested. Individual A shows 5% E Asian and individual B shows 10% E Asian. Based on this most would think that B has greater E Asian geneflow or admixture than A, however, the truth is we don’t know simply based on these admixture percentages. Here is why. Let’s say that A and B share the following number of alleles with the calculator source populations:
| Test subject | Ethnicity | Number of matching alleles with | ||
| E Asians | Africans | Europeans | ||
| A | S Asian | 30 | 5 | 15 |
| B | W Asian | 40 | 10 | 50 |
Table 1 – Number of matching alleles between 2 users and calculator source populations
For simplicity assume the total number of population defining alleles used in the calculator is the same for each population. Thus the W Asian user shares 40 alleles with E Asians, whereas the S Asian user shares 30 alleles with E Asians as shown in the aforementioned table. Therefore we can infer that the W Asian individual has more E Asian admixture than the S Asian individual.
To calculate the calculator E Asian admixture percentage for A all we do is the following; E Asian = [30 / (30+5+15)] x 100. We do the same for all the other categories to obtain the following:
| Test subject | Ethnicity | ADMIXTURE PERCENTAGE | ||
| E Asian | African | European | ||
| A | S Asian | 60% | 10% | 30% |
| B | W Asian | 40% | 10% | 50% |
Table 2 – Admixture percentages calculated based on the results from table 1
Notice that in spite of the W Asian individual having greater E Asian admixture than the S Asian individual as shown in table 1, table 2 shows that the S Asian individual has a higher E Asian admixture percentage. This is the reason we can’t use admixture percentages to objectively quantify total geneflow or admixture from a population. Thus GSI which is a one to one comparisons of the number of matching alleles between the test individual and the calculator source populations, should be used for inferring geneflow or admixture from a source population. GSI as shown in figs 3 & 4 is one of the metrics outputted in SAPDA.

Fig 18 – British user shares 2 out of 6 defining alleles with E Asians on a “Deep Ancestral” time scale; 1 copy of the “G’ allele at chr2-rs12477830, and 1 copy of the “C” allele at chr2-rs12476238. The lower bar plot indicates that these alleles are also present at a relatively high frequency of about 38% in AMR, thus indicating that these are relatively older mutations, likely dating to the Upper Paleolithic and predating the split between AMR & EAS

Fig 21 – Sudanese user shares no E Asian defining mutations with E Asians on a “Deep Ancestral” level

Fig 22 – Sudanese user shares no European defining mutations with Europeans on a “Deep Ancestral” level
SAPDA SOFTWARE AVAILABILITY
An announcement will be made here when the production version of the software is deemed ready for testing.
COMMERCIAL LICENSES
Please contact Dilawer@EurasianDNA.com for commercial software license inquiries.


